
March 2025
Lubbock's economy experienced modest growth last month, with retail sales seeing a slight increase compared to the previous month.
Both new and used vehicle sales saw an uptick. Tourism also saw growth, partially due to sports events related to Texas Tech. Employment continues to be favorable. Residential building activity showed a year-to-date increase, while commercial construction experienced a decline. Inflation and interest rates continue to influence building activity. The future growth will largely depend on fiscal policies from Washington in the coming months.
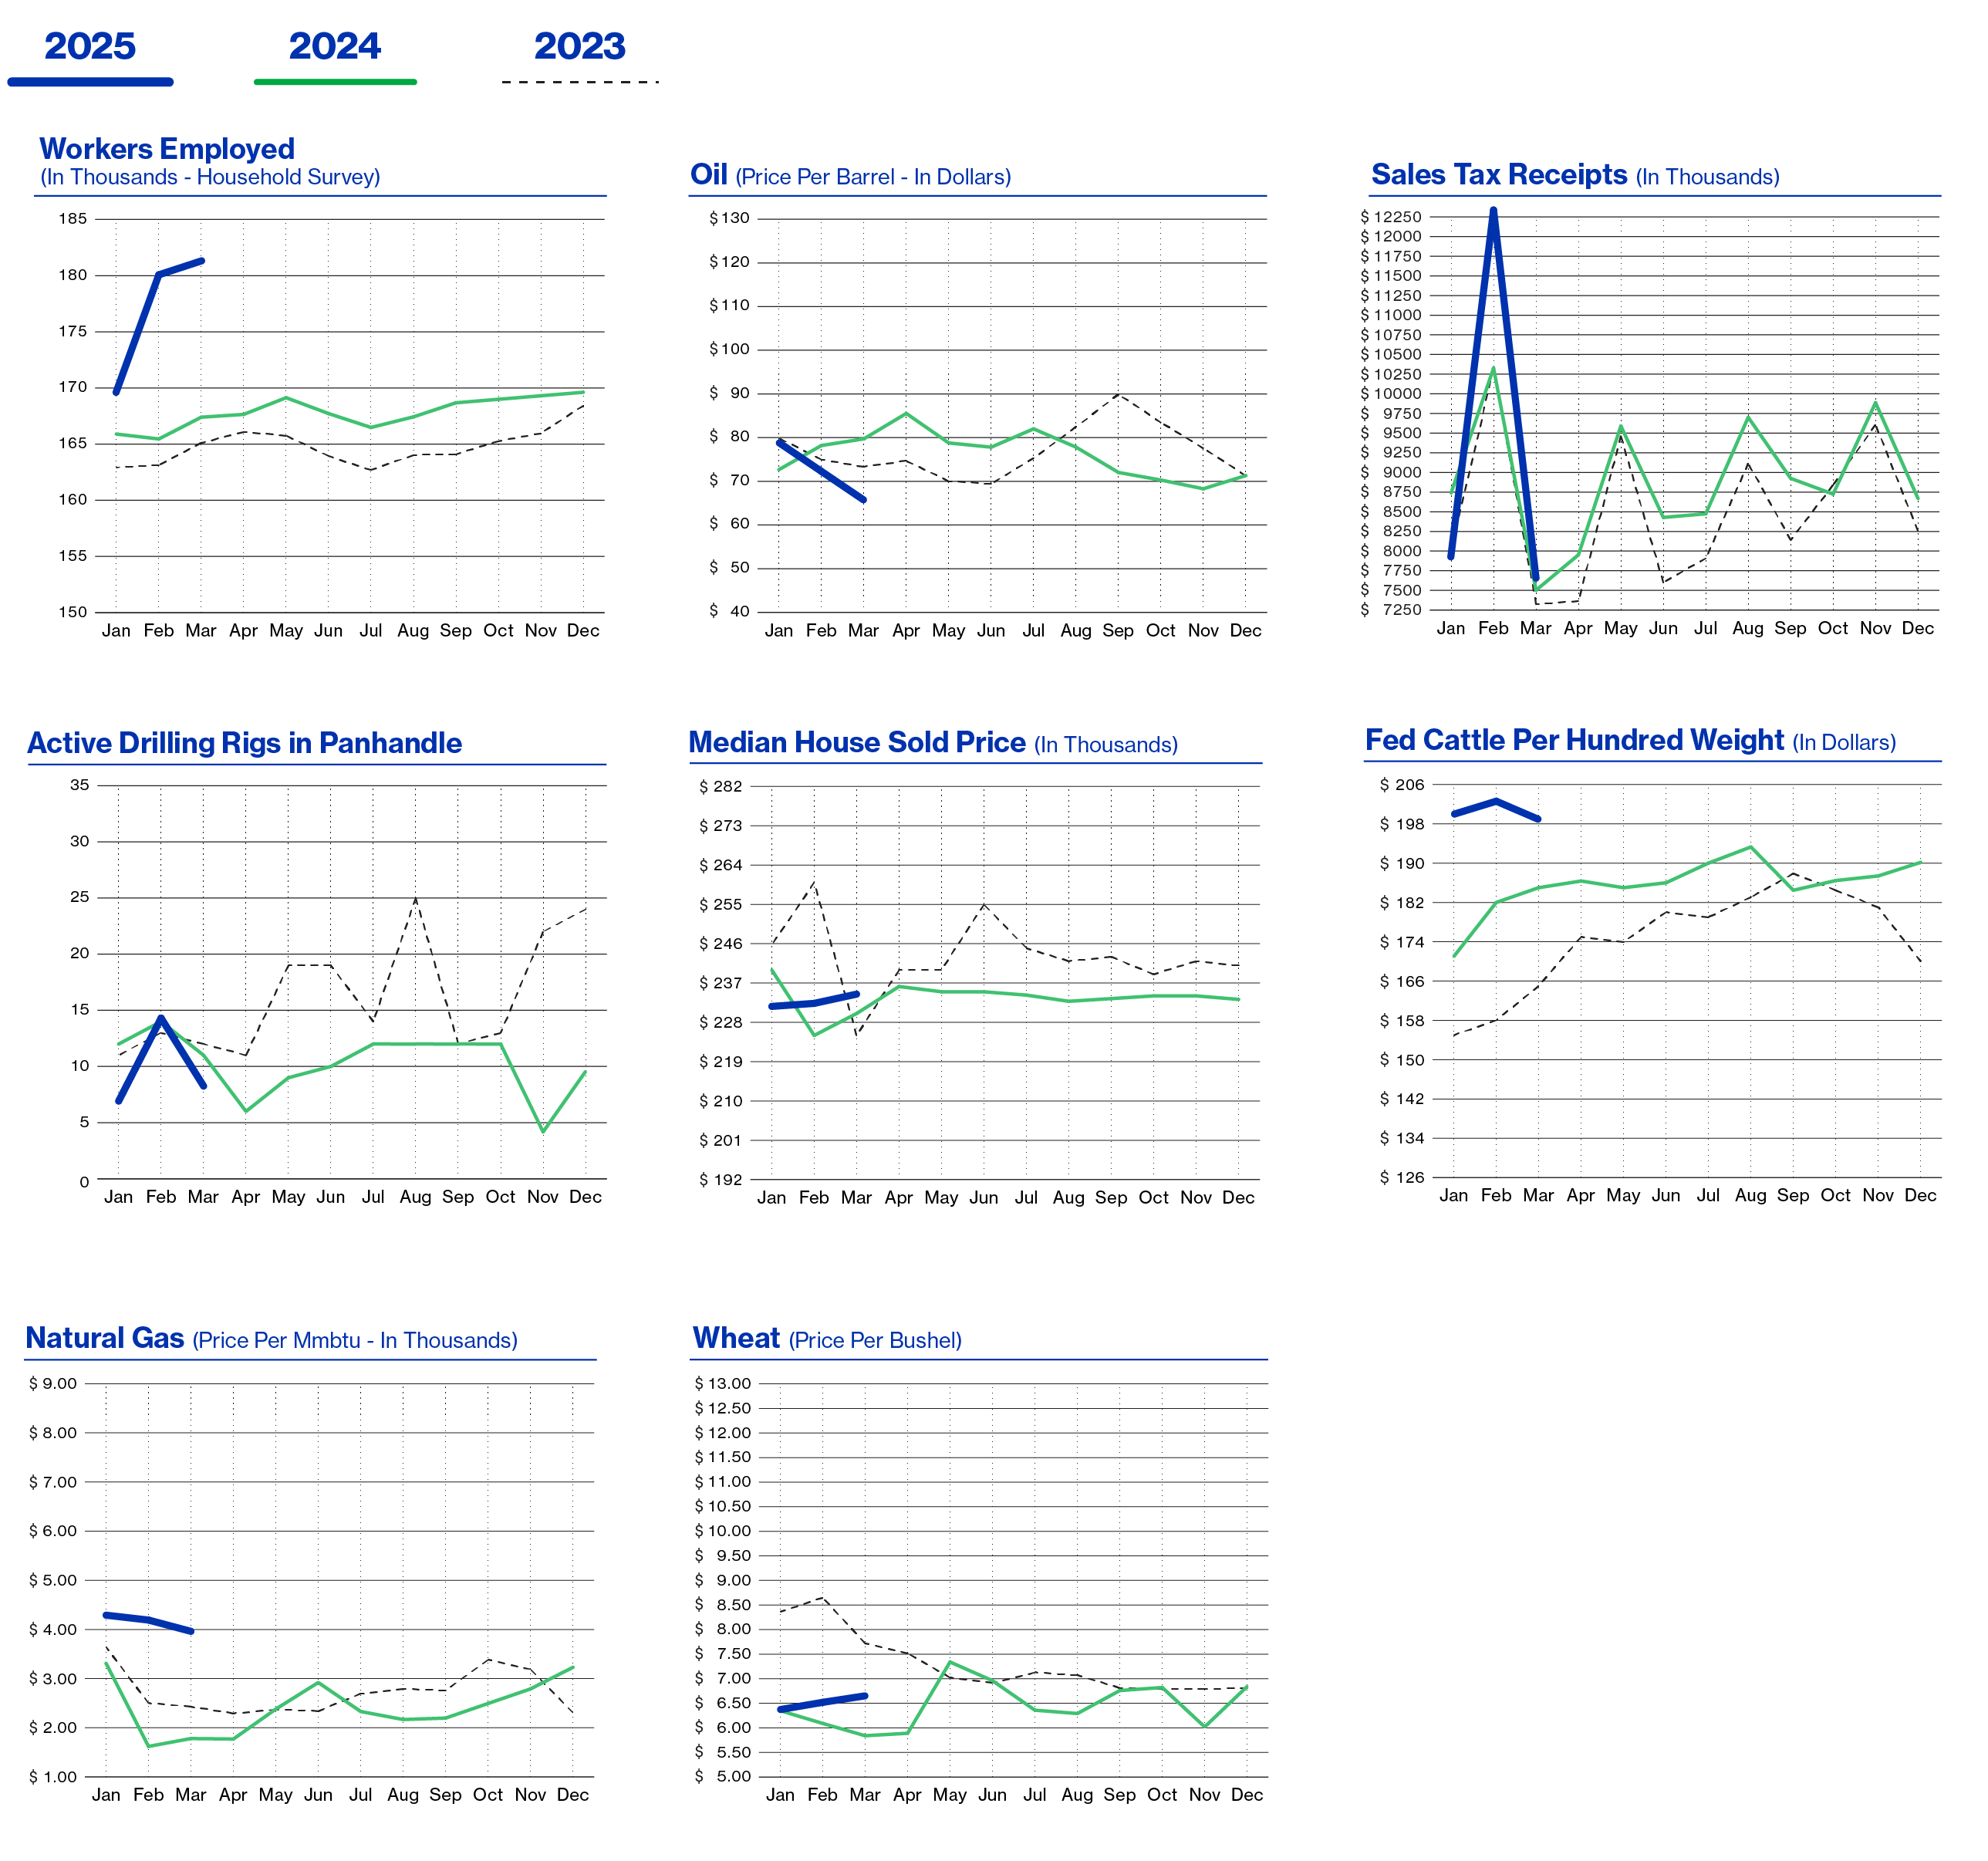
Retail sales in February 2025 saw a 1.64% increase compared to February 2024. Year-to-date sales for 2025 reached $27.97 million, reflecting a modest growth of $1.4 million, or 5.26%, from the same period in 2024. New vehicle sales for February 2025 totaled 982 units, marking an 18.03% rise compared to February 2024. Used vehicle sales for the month reached 1,868 units, showing a 5.24% increase over February 2024.
Tourism in Lubbock saw a notable spike in February 2025, driven by an increase in travel by vehicle. Hotel/Motel tax collections rose by 9.64%, or about $58,000, compared to February 2024. This surge indicates a strong influx of visitors, reflecting a boost in local tourism activity. However, airline boardings in February 2025 dropped by 4.46% compared to the same period last year.
Over the past 12-months, the number of employed workers in Lubbock has risen by 8.43% (or 13,600) according to the Employer Survey, and by 2.13% (of 3,780) according to the Household Survey. The labor force has grown by 2.24% since February 2024, and wages have experienced a modest increase of 1.75%. As of February 2024, the unemployment rate stands at 3.70%, up slightly from 3.60% in February 2024.
In February 2025, building permits totaled $64.95 million, representing a decline of $7.9 million or 10.87% compared to last year. The median home price for the month was $235,000, reflecting a 2.16% increase from the previous year.
Residential building activity in February 2025 totaled $46.4 million, reflecting a small increase of 2.86% compared to February 2024. In February 2025, a total of 141 residential building permits were issued, showing a decrease of 31 permits, or 18.02%, compared to February 2024. Mortgage rates remained relatively high at 6.875% although this marks a 1.79% decrease from the rates during the same period last year. Residential activity for YTD 2025 has increased by $27.8 million, or 30.56%, compared to 2024, indicating a positive trend in building activity for the year ahead.
Combined residential and commercial building activity in 2025 is 10.87% lower compared to the same period in 2024, reflecting a decrease of $7.93 million. While residential building activity rose by $27.8 million, commercial building activity fell by $35.7 million. Notably, no large commercial projects were permitted this period, with high interest rates and construction costs continuing to be significant factors.
As of February 2025, oil prices stand at $67.61 per barrel, reflecting a 17.01% decrease compared to the same period last year. In contrast, natural gas prices have surged to $3.99, marking a significant increase of 134.71%. The oil rig count has dropped 13 rigs in January 2025 to February 2025 from 13 rigs to 8 rigs in February
2025. In agricultural markets, wheat prices have risen by 13.18%, reaching $6.61 per bushel, while corn prices have climbed 2.78% to $4.43 per bushel. Cotton prices, however, have fallen by 28.14%. Additionally, fat cattle prices have increased by 7.57%, contributing to a 12.50% rise in milk prices. Still waiting on moisture for spring planting season.
Economic Pulse
| Economic Components | Current Month | Last Month | Last Year |
|---|---|---|---|
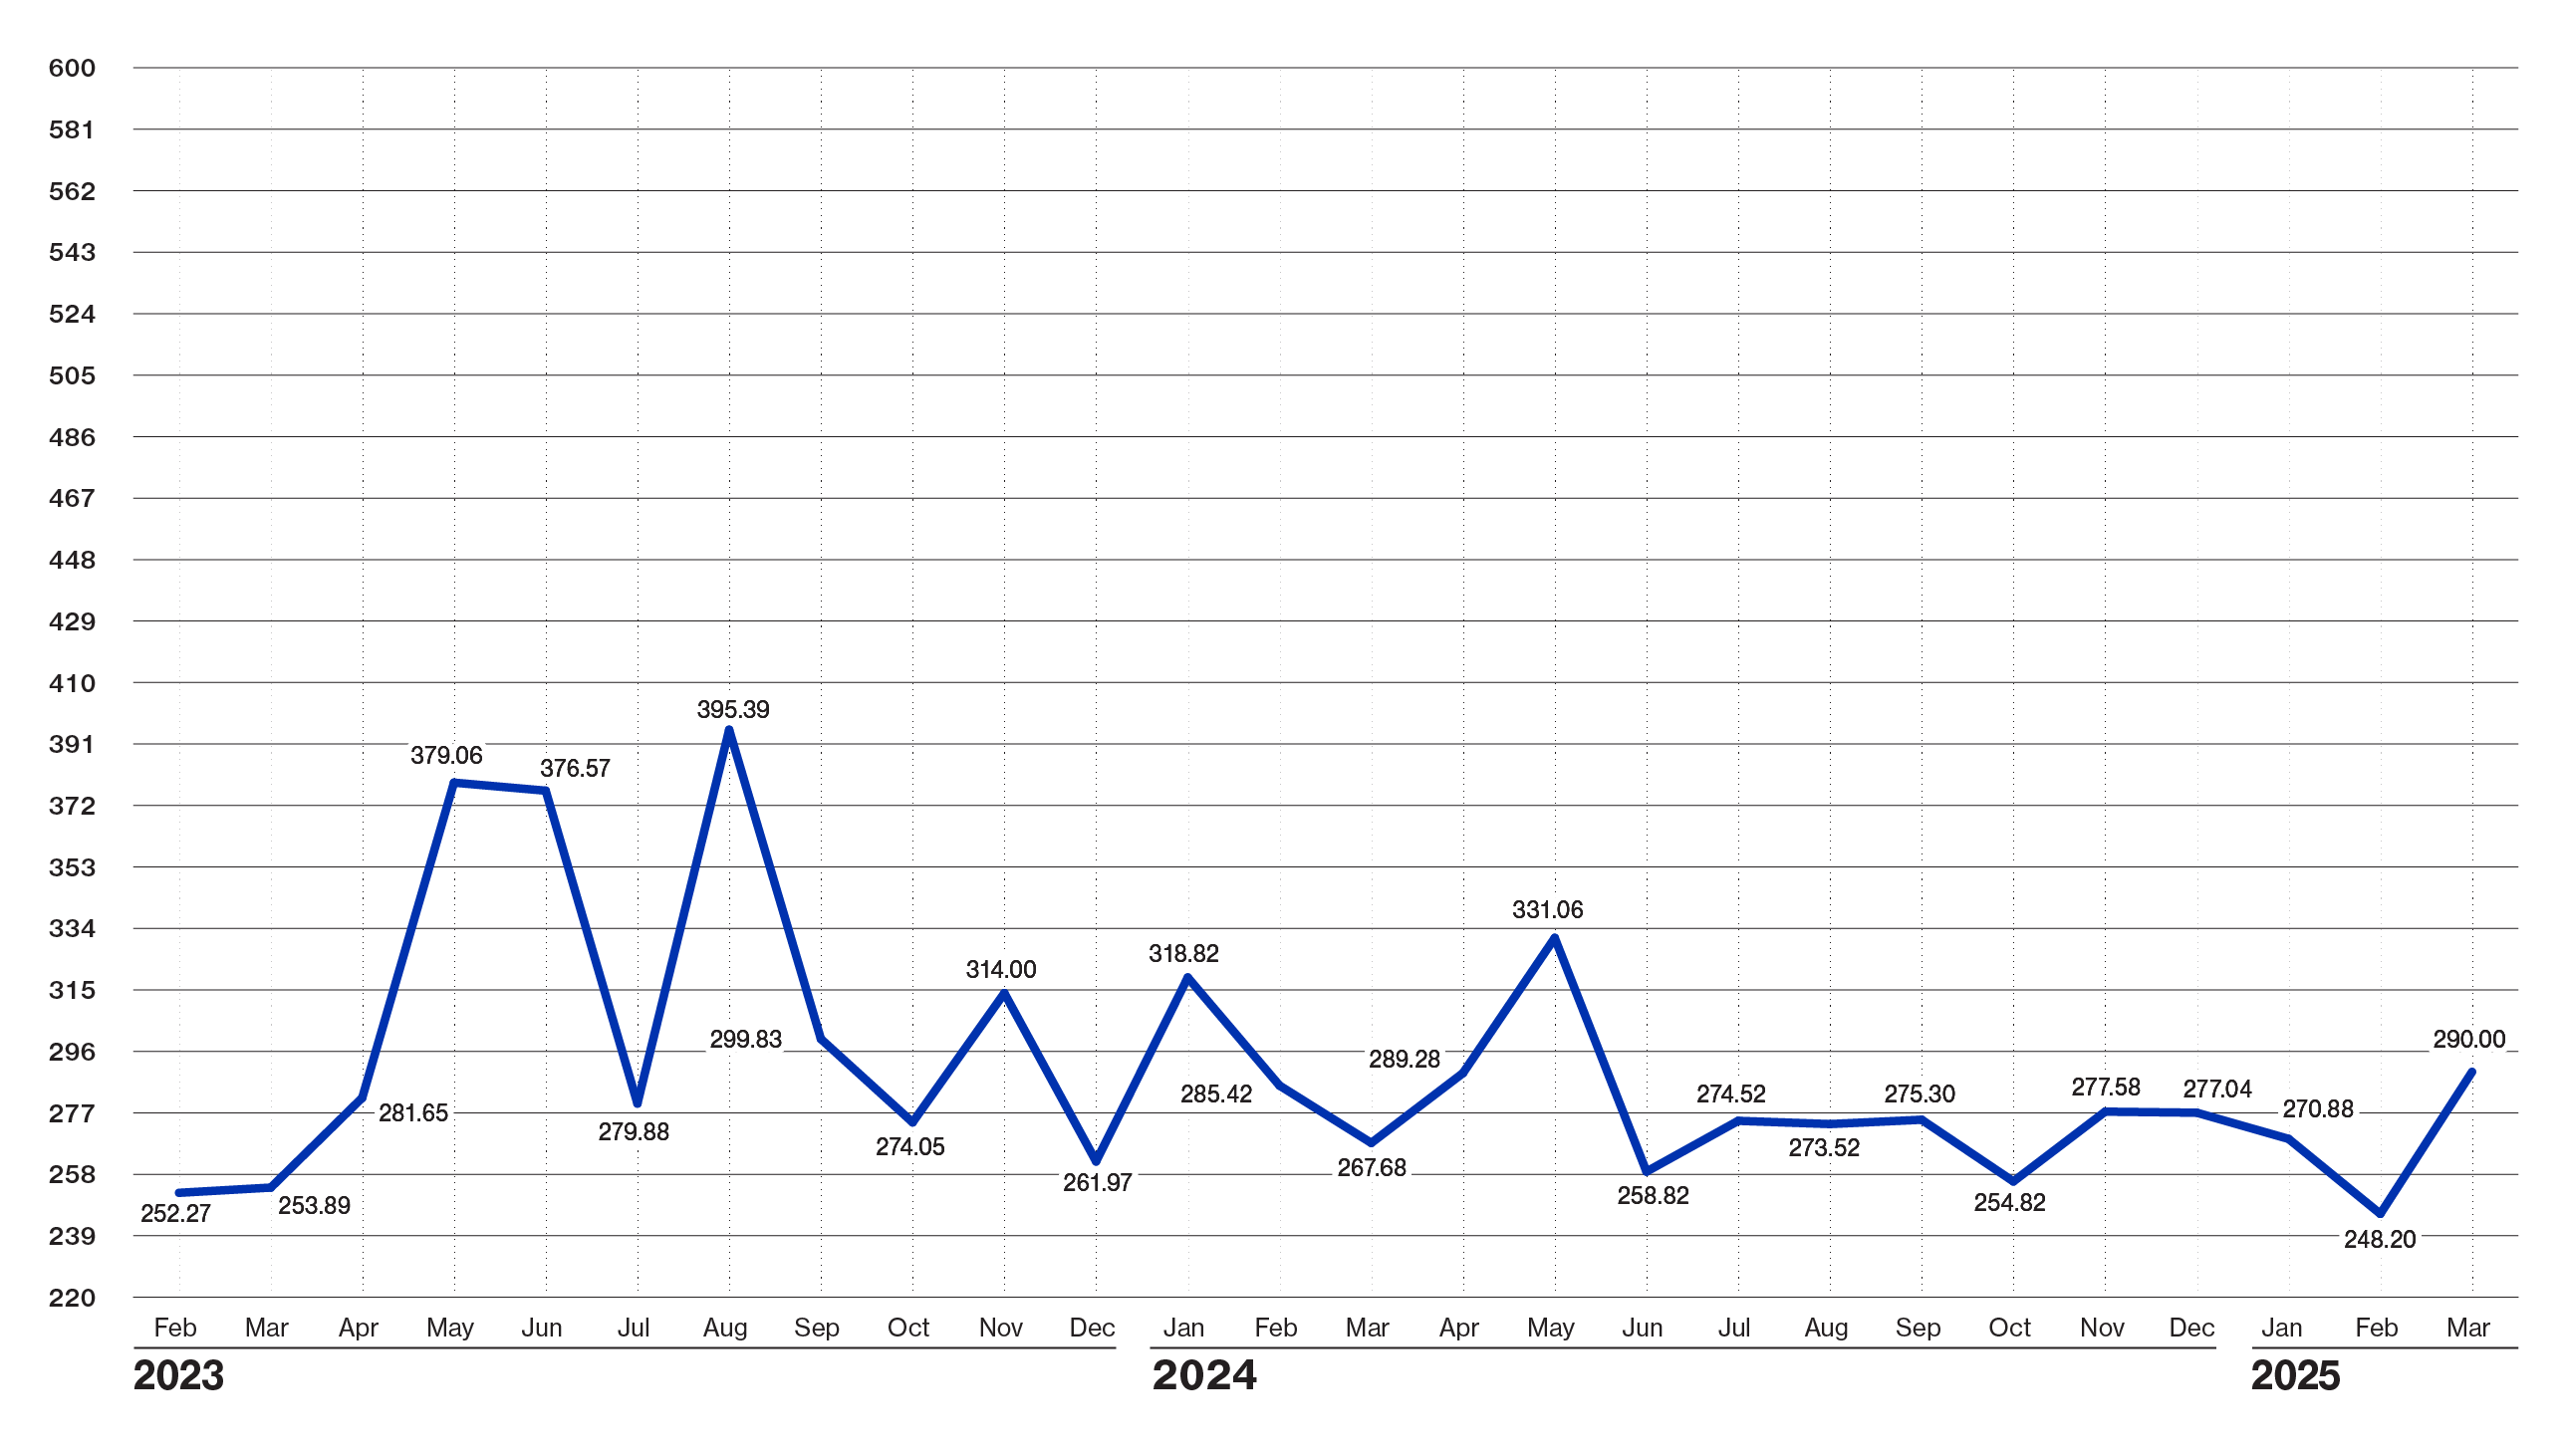
| Index (Base Jan. 88 @ 100) | $ 290.00 | $ 248.20 | $ 267.68 |
| Sales Tax Collections | $ 7,624,408 | $ 12,450,488 | $ 7,501,745 |
| Sales Tax Collection-YTD | $ 27,965,052 | $ 20,340,645 | $ 26,568,692 |
| New Vehicle Sales | 982 | 1,049 | 832 |
| Used Vehicle Sales | 1,868 | 1,687 | 1,775 |
| Airline Boardings | 40,030 | 40,046 | 41,898 |
| Hotel/Motel Receipt Tax | $ 663,575 | $ 704,443 | $ 605,255 |
| Population | 263,648 | 263,648 | 263,648 |
| Employment - CLF | 188,450 | 186,747 | 184,314 |
| Unemployment Rate | % 3.70 | % 3.50 | % 3.60 |
| Total Workers Employed (Household Survey) | 181,445 | 180,176 | 177,665 |
| Total Workers Employed (Employers Survey) | 174,900 | 173,800 | 161,300 |
| Average Weekly Wages | $ 1,044.00 | $ 1,044.00 | $ 1,026.00 |
| Gas | 79,167 | 78,955 | 78,536 |
| Interest Rates: 30 Year Mortgage Rates | % 6.875 | % 6.875 | % 7.000 |
| Building Permits Dollar Amount | $ 64,956,139 | $ 94,912,457 | $ 72,881,947 |
| Year to Date Permits | $ 159,868,596 | $ 94,912,457 | $ 175,076,579 |
| Residential Starts | 141 | 139 | 172 |
| Year To Date Starts | 280 | 139 | 299 |
| Median House Sold Price | $ 235,000 | $ 233,495 | $ 230,028 |
| Drilling Rigs In Panhandle | 8 | 13 | 11 |
| Oil Price Per Barrel | $ 67.61 | $ 72.53 | $ 81.47 |
| Natural Gas | $ 3.99 | $ 4.20 | $ 1.70 |
| Wheat Per Bushel | $ 6.61 | $ 6.52 | $ 5.84 |
| Fed Cattle Per CWT | $ 199.00 | $ 203.00 | $ 185.00 |
| Corn Per Bushel | $ 4.43 | $ 5.02 | $ 4.31 |
| Cotton (Cents Per Pound) | $ 63.32 | $ 63.39 | $ 88.11 |
| Milk | $ 18.45 | $ 20.31 | $ 16.40 |
Heads up, it’s time for the legal spiel!
This document was prepared by Lubbock National Bank on behalf of itself for distribution in Lubbock, Texas and is provided for informational purposes only. The information, opinions, estimates and forecasts contained herein relate to specific dates and are subject to change without notice due to market and other fluctuations. The information, opinions, estimates and forecasts contained in this document have been gathered or obtained from public sources believed to be accurate, complete and/or correct. The information and observations contained herein are solely statements of opinion and not statements of fact or recommendations to purchase, sell or make any other investment decisions.
Economic Pulse Charts
{beginAccordion h3}
2025 Economic Analysis
{endAccordion}
{beginAccordion h3}
2024 Economic Analysis
{endAccordion}
{beginAccordion h3}
2023 Economic Analysis
{endAccordion}